
What is Popular Price Analytics? #
Popular Price Analytics (PPA) is a data-driven tool that identifies the most popular sale and rental prices for properties, leveraging real estate data to provide quick access to price trends and user interest, enabling agents to price properties competitively and attract more buyers.
How can I access Popular Price Analytics? #
Follow the step-by-step guide below to use Popular Price Analytics:
1. Login to AgentNet and select ‘DataSense’ on the left navigation bar. Locate the Popular Price Analytics widget and click on Take Me There.

2. PropertyGuru for Business portal will open in a separate window. You can access Popular Price Analytics under the ‘Unit Research’ category.

NOTE: If this is your first time logging in, follow the steps here to access DataSense.
3. Start by searching for a Project using the drop down. We will use Parkshore to demonstrate the search. Type and select the project.

4. Next, input the size of the property you wish to analyse following the recommended range and hit “Search”.

5. View the Popular Price Analytics by trends of Sale price, Rental price, and Rental Yield in the first section.

6. To dive deeper, click on “View Popularity Distribution” under the sale or rent tiles where you will be shown the listings used to analyse this price.


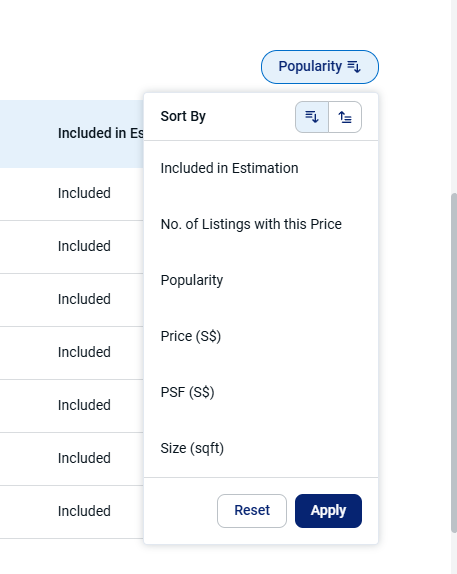
7. These listings are sorted by popularity. Popularity is defined by visitors’ preference for Price and PSF, e.g. how many % of visitors preferred a particular price. You can sort these data using other customised filters.

8. To ensure you cover all bases, use the “Exclude from Estimation” option to view listings we have excluded due to low popularity.

We hope this guide helps you make the most of Popular Price Analytics!